

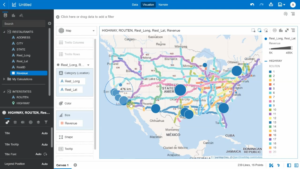
Oracle Analytics Update – May 2021
Oracle Analytics just keeps getting better! OA added a host of new features in late 2020 and early 2021. No single article could do them all justice, so this blog will provide a high-level review

Better Decision-Making With BI and Analytics
We hear the same frustrations over and over again from our clients regarding their legacy Business Intelligence and Analytics systems: We’re swimming in data, but everyone has their own opinion on what’s important. Most users

How to Retain Knowledge When a Key Member of the Analytics Team Leaves
Everyone knows that change is the only constant in life. People will inevitably come and go from your analytics team. You cannot prevent it – but you can prepare for it so that personnel transitions
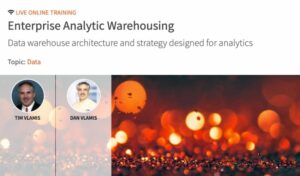
Vlamis Webinar – Enterprise Analytic Warehousing with O’Reilly on October 29, 2020 9:00am – 12:00pm CDT
An analytic warehouse is designed for the explicit purpose of producing and delivering analytic results. It’s unlike most traditional data warehouses which ended up mostly just storing data. My brother Dan and I are teaching
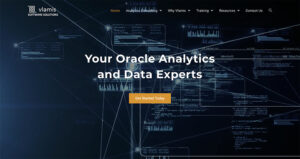
Vlamis Rolls Out New Online Oracle Analytics Resources
Vlamis Software Solutions is not your typical analytics consulting firm. We are industry changemakers, built from the ground up to support you on your Oracle Analytics journey. We meticulously apply over three decades of experience

Enterprise Data Visualization Class Less Than a Month Away
In less than one month, Dan and I will be teaching Enterprise Data Visualization: Executive Dashboards and Managerial Displays for O’Reilly Live Online Training (Wednesday, September 30 from 11:00 a.m. to 2:30 p.m. Central). The
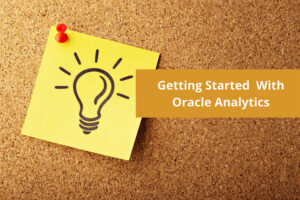
Getting Started with Oracle Analytics – 2020 Edition
Have you ever wondered how to get started with Oracle Analytics? I have addressed this topic in the past, but in the fast-paced world of technology, last year’s information is soon outdated. Many resources on

New to Predictive Analytics? Bet on a Process, Not on a Project
Advanced Analytics Projects Are Atypical Successful projects using data mining algorithms often have returns that are well above normal business Returns on Investment. 200%, 500% or even 1000%+ ROIs are not unheard of. So why
A Primer on Security and Access in Oracle Analytics
If you read the Oracle documentation on Oracle Analytics with the intent of coming away with a basic understanding of how to plan and execute security, you might find yourself feeling lost. While the documentation
