


We hear the same frustrations over and over again from our clients regarding their legacy Business Intelligence and Analytics systems:
- We’re swimming in data, but everyone has their own opinion on what’s important.
- Most users just want to export data out of the system into Excel.
- We have lots of numbers on our dashboards, but they don’t really support decision making.
- We did a lot of work defining KPIs and business metrics, but we’re struggling with visualizing them and using them in decision making.
These issues stem from several sources, but the most common one is not recognizing the difference between supplying raw data and supplying analytic insight. Consuming raw data is like consuming raw food. Sometimes raw is fine and even preferred, other times it’s nearly impossible to chew, swallow, and digest.
Can everyone in a business effectively clean, prepare, cook, season, plate, and present raw data? Not really. Executives may dine in fancy restaurants and know what they like to eat, but that doesn’t mean they know how to run a professional kitchen.
Most decisions in organizations are not made by a single person sitting in front of a screen waiting on a flood of data to push a button and make something happen. Instead, good decisions arise from a group of people understanding the facts of a situation and the implications of different courses of action.
A major part of achieving that shared understanding is providing context and comparison, along with a “raw” KPI (key performance indicator), in an easily understandable manner. This is most effectively done with properly designed visualizations, but be careful—just as bad service can ruin a great meal, bad visualizations can ruin a great data set.
How the Four Realms of Decision-Making Help With Data Modeling and Dashboard Design
We can break down decision making into four quadrants based on two dimensions:
1) The duration of decisions or how long the impact of an individual decision persists and the latency of decisions
2) How long the period of time is between recognizing the need for a decision and then making the decision.
While we identify four different quadrants (low impact/short term, high impact/short term, low impact/long term, and high impact/long term), both dimensions exist as continuous ranges and not discrete values. So every decision falls somewhere on the gradient and the lines are blurry, not hard.
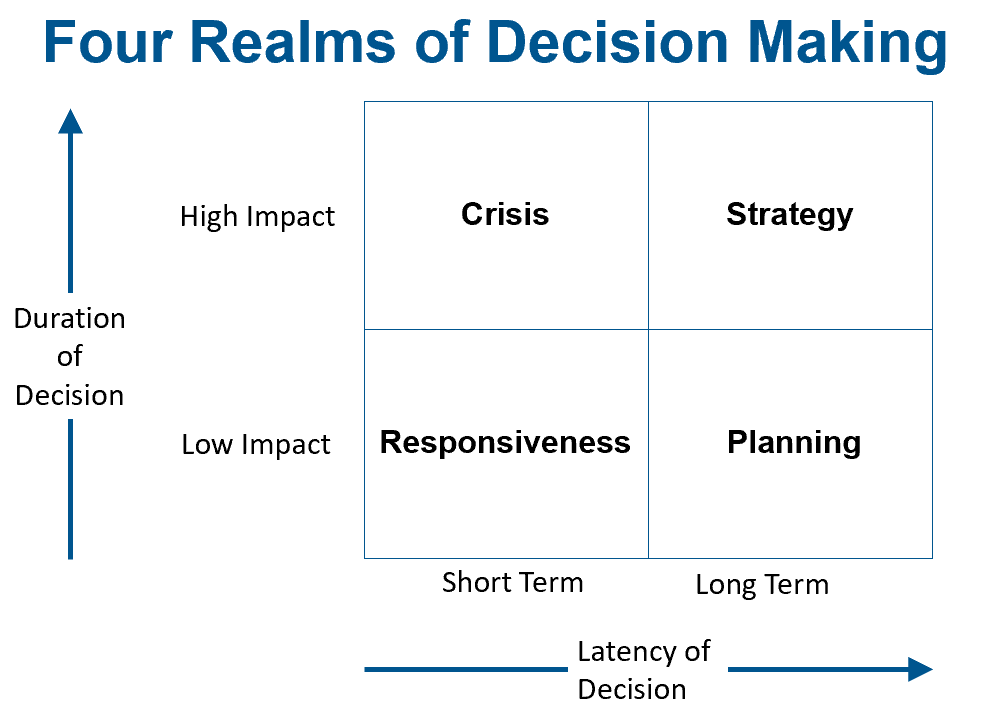
Responsiveness Quadrant – Short Term, Low Impact
Most organizational decisions are made relatively quickly and have a relatively short duration. Examples of questions asked in this quadrant include:
- What other products do we recommend to a customer who just made a purchase?
- Should we produce product x or product y next on this particular piece of equipment?
- Which customer do we call next?
- Which person do we hire?
This is not to minimize the importance of day-to-day decision making in a corporation, but to acknowledge that there are thousands of decisions that collectively have great importance, but individually do not. The key aspect of this quadrant is responsiveness. That is, making decisions quickly and effectively.
Organizing data for the responsiveness quadrant is all about fast and accurate data delivered to individuals. Departmental data marts shine here. We often start engagements with a project in the responsiveness quadrant because of the focused nature of the requirements.
Crisis Quadrant – Short Term, High Impact
Some organizational decisions have to be lived with for a very long time. In other words, they have a long duration. When high impact decisions are made very quickly, they are typically done in response to a crisis situation.
Although it is possible that large organizations might make high impact decisions in response to positive opportunities, we find that in reality, most organizations are primarily motivated by risk aversion in short term latency situations.
Preestablished thresholds are important in defining what constitutes an exceptional situation. Not only is this useful in sensing an event that requires a response; it can also help determine when the decision can take more time. In essence, the only way to know where on the X-axis a particular data point exists is to pre-identify the comparison thresholds.
Strategy Quadrant – Long Term, High Impact
When high impact decisions take more time in the decision-making process and have a longer latency, they move from the crisis quadrant to the strategy quadrant. Decisions in the strategy quadrant tend to have significant requirements from analytics systems because of the importance of each individual decision, and because their complexity tends to require a broader set of data.
Examples of high impact long term decisions include acquisitions, major business site selections, and equity offerings. Strategy quadrant decisions often rely on “what if” analysis and scenario planning.
Monte Carlo models and other advanced techniques can greatly enhance these analyses, particularly when they are built within the analytics system. Data extraction to an external system (such as Excel) often hides critical assumptions. This makes the analysis less dynamic and responsive to broad changes in the business environment, as we are experiencing during the COVID-19 pandemic. These decisions often have high enough risks and return to justify significant investment in both data modeling and visualization/presentation.
Planning Quadrant – Long Term, Low Impact
Most business decisions that require coordination across multiple groups within an organization fall into the planning quadrant. These are decisions that individually are not important but collectively carry great weight.
Decisions relating to pricing, brand positioning, training versus hiring, and other HR-related decisions all fall into this quadrant. Consistency, coordination across different functions, and collaboration are all facilitated by effective analytics systems.
This is where dimensional modeling and aggregations, custom calculations, and normalized data for comparisons play an enormous role in supplying insight and guidance, rather than raw data which is often difficult to consume.
Decision-Making Goals Drive Design
Understanding decision-making and breaking down decisions help us design effective analytics systems.
We seek to understand where each dashboard falls on the duration and latency dimensions. Short-term quick response dashboards tend to be rather specific and we work to match the grain of the data presented with the grain of the decision.
For example, when designing a daily dashboard, we focus on relatively short-term trends over a period of time in which measuring by days makes sense, say 10 days – 30 days. We won’t show a three-year trend line graph.
A comparison graph showing differences between the same day last year, forecast, and predicted by a trained machine learning model could immediately reveal important insights. Likewise, dimensional drills into specific data slices can also be extremely important. We tend to spend more time on data selection and predefined drill paths in the short-term low impact quadrant.
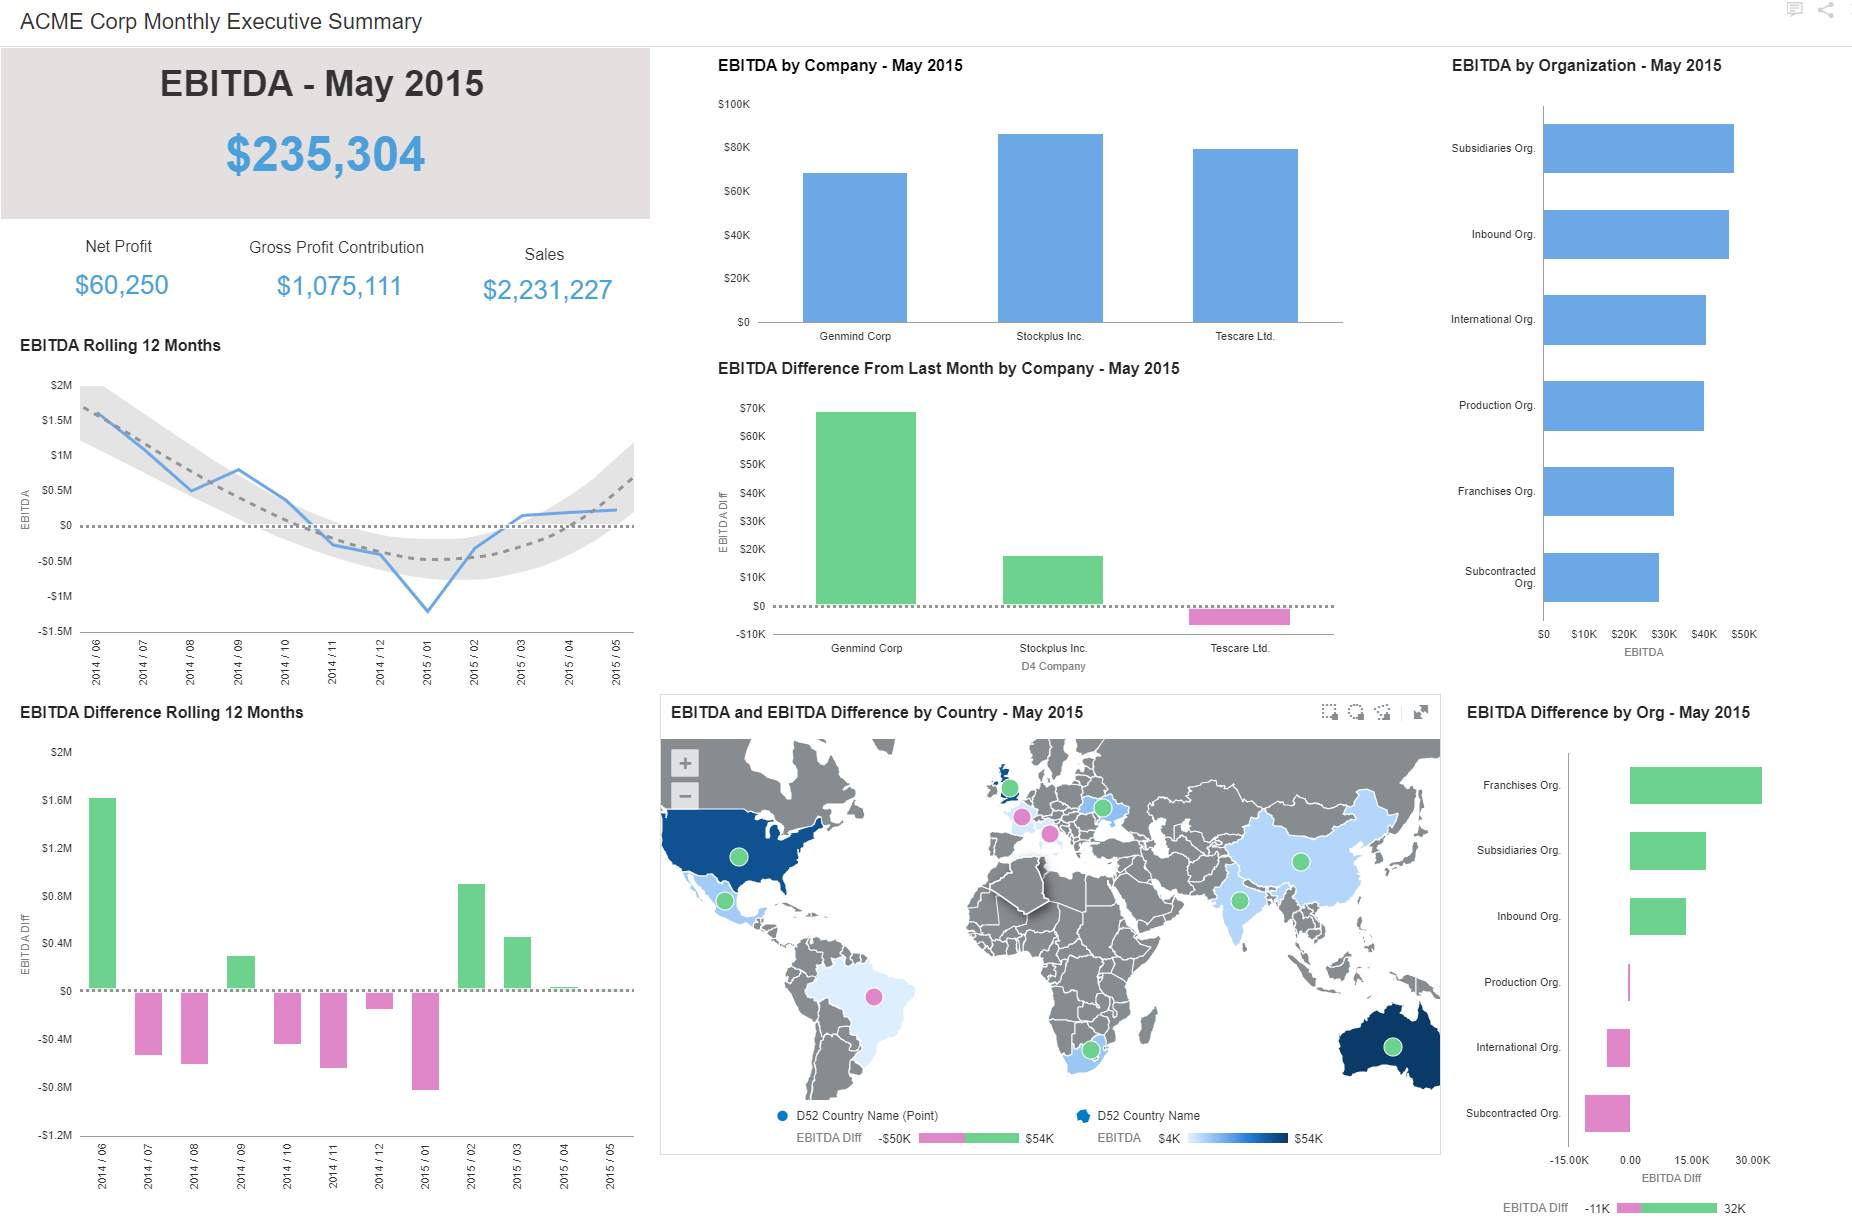
The following dashboard shows examples of visualizations that have been informed by decision-making frameworks.
We use many frameworks for effective analytics systems to support decision-making in large, complex organizations. For example, our dashboard importance rubric helps our clients discern where to spend their time and money during the development process.
Building a great analytics system is like running a world-class restaurant. You want everyone to feel like they had an individual experience, but you also need well-honed systems and teamwork behind the scenes to make everything work.
Just as everyone is an expert on their favorite food, everyone in a business knows what data they like. There are talented home cooks who know how to fix complex dishes for themselves and their families, but they may not know how to prepare food for hundreds of people.
Likewise, just because someone knows what they like in terms of analytics, that doesn’t qualify them to design a system for hundreds or thousands of other people. Instead, you need strong frameworks to guide choices in the design of analytics systems and dashboards, so that organizational decision-making and shared understanding are optimized.
