Analytics and Reporting Teams
We understand the challenges you face.
Turning Data into Insights
You need data you can trust and architecture optimized for speed and reliability. Our experts meet those needs, then set you up with flexible, easy-to-use tools for creating reports and dashboards. Add cutting-edge capabilities such as exception reporting, alerting, and advanced filtering and you will be able to deliver the insights your organization needs.
Find Answers Quickly and Easily
Our techniques structure data for speed and ease of use – creating what we call an Analytic Warehouse. We develop and teach you how to build visualizations built on that data. These visualizations follow best practices, improve reporting, and encourage widespread adoption. The right analytics go beyond basic reporting to reveal the causes of unexpected results and enhance decision-making.
Work We've Done

Case Study: Bowie State University
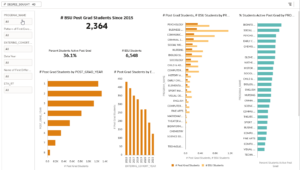
Bowie State University (https://www.bowiestate.edu/) is the oldest HBCU in Maryland and part of the University System of Maryland. With an enrollment of over 6,300 students and offering 28 undergraduate, 20 Master’s, and 3 doctoral programs, Bowie State generates and collects a wide variety of student data, from enrollment to retention to graduation and beyond.

Case Study: Rosendin Electric
Rosendin had recently begun migrating from Oracle Business Intelligence (OBIEE) 11.1.1.7 to OAC and had high expectations for their new system but were finding it difficult to get timely, quality results from it. At Oracle’s suggestion, they reached out to Vlamis and we identified root problems with the way OAC was being implemented. By taking a different approach to the implementation and capitalizing on OAC’s Data Visualization interface, we were able to demonstrate the true value of OAC to them.

Case Study: Sacramento County 311 Connect Analytic Reporting
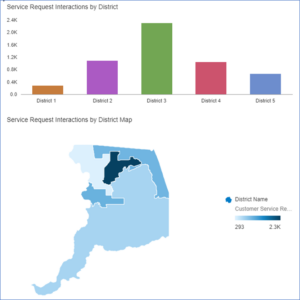
Sacramento County, centrally located in the state of California, provides a 311 Connect service to help with non-emergency issues for residents in unincorporated parts of the county. The service requests result in mountains of data to report and analyze – including a Monthly Customer Service Report that Sacramento County wanted to redo using Oracle Analytics Cloud (OAC).
Let Us Help You
Whether you want to improve analytics adoption in your department or develop visualizations that get everyone on the same page, you need data and analytic solutions you can count on. At Vlamis Software Solutions, we understand those needs. As analytics experts, we can assess your current analytics systems and processes; develop dashboards and visualizations that reveal trends and relationships; upgrade or fine-tune your analytic warehouse architecture; and provide prototypes and proofs of concept that demonstrate the value of the data-driven approach to decision making. Put our expertise to work for you!
Assessments and Health Checks
Dashboards and Visualizations
Performance Tuning
Prototypes and Proofs of Concept
Our Top 3 Courses for Analytics
and Reporting Teams
Our training breaks down the complexities of Oracle analytics with best practices and a hands-on approach in a format that works for you – from classes to workshops to individual mentoring. We empower you to get the most from your data and analytics systems.
Latest Articles for Analytics and Reporting Teams
Design Is Why April’s Oracle ACE Adventure Was the Perfect Start to an Amazing Week
Being a part of the Oracle ACE program has been one of the most rewarding experiences I’ve had in my professional career. As a community, we’re passionate about technology in general, and Oracle’s specifically, and how we can share what we’ve learned and give back to our community. However, one of the best aspects of the program is that it recognizes that personal growth is not limited to a singular realm or outlook.

Lessons Learned from Entering the 3rd Annual ODTUG/AnDOUC Oracle Analytics Storytelling Challenge
For the past several years, ODTUG has hosted a competition where developers are given the same data set and asked to prepare a “data story” told through visualizations using Oracle Analytics Cloud. This year’s data

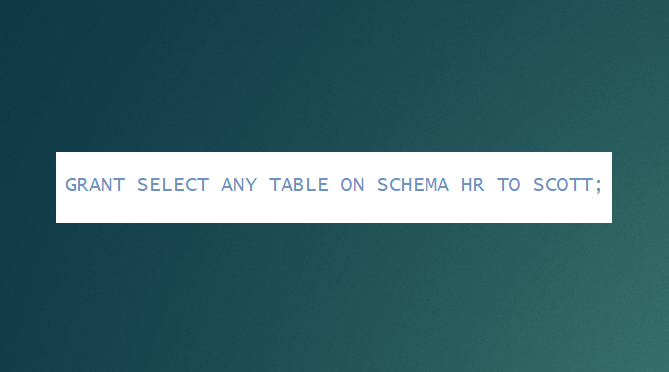
Schema-level Privileges Simplify Grants in Oracle Database
With Oracle database 23C, we finally have the ability to GRANT SELECT ANY TABLE on SCHEMA. When I was originally introduced to multiple schemas in the Oracle database, I was baffled by why DBAs seemed
Vlamis Experience
At Vlamis, we specialize in both databases and analytics. Our clients have benefited from our experience and expertise – you can too!
Our Qualifications
- Oracle Gold Partner, one of first 5 to earn Oracle Expertise in Oracle Analytics in North America
- Multiple Oracle ACE designations
- Sponsor of Oracle Global Leaders
- Authors of Oracle Press books Data Visualization for Oracle Business Intelligence 11g and Oracle Essbase & Oracle OLAP: The Guide to Oracle’s Multidimensional Solution
- Presented 300+ sessions at Oracle OpenWorld and national and regional Oracle user group conferences over the past 20 years
- Lead the Analytics and Data Oracle User Community
- Developers of the Force Directed Graph plugin available in Oracle’s Analytics Library
- Named contributor to Oracle University’s Advanced Analytics curriculum (Oracle Data Mining and Oracle R Enterprise)
Our Technologies
Analytics
- Oracle Analytics Cloud (OAC)
- Oracle Analytics Server (OAS)
- Fusion Analytic Warehouse (FAW)
- Oracle BIEE
- Oracle BI Applications
- Fusion Data Warehouse
- Oracle Exalytics
- Analytics/BI Publisher
- Oracle MapViewer
- Tableau
- MS Power BI
Data
- Oracle Database
- Oracle Machine Learning
- Oracle Advanced Analytics
- Oracle Data Mining
- Analytic Views
- Oracle Database In-Memory
- Oracle Spatial & Graph
- Oracle Exadata
- Oracle Database Cloud Service
- Essbase
- MS SQL Server
Integration and More
- Oracle Data Integrator (ODI)
- Oracle GoldenGate
- Oracle Warehouse Builder
- SQL Developer
- Oracle JDeveloper
- Oracle Cloud Infrastructure (OCI)
- Data Catalog
- Source Control
