

For the past several years, ODTUG has hosted a competition where developers are given the same data set and asked to prepare a “data story” told through visualizations using Oracle Analytics Cloud. This year’s data included actual and scheduled airline departure and arrival times. The data was hosted in an Oracle Autonomous Data Warehouse instance. It’s a bit like a cooking challenge where everyone gets the same basket of ingredients, and each chef is asked to prepare a meal within a limited amount of time. There were two levels you could enter in: beginner and expert.
I entered in the “Expert” category and to my great surprise, won first place in the competition! Here are some thoughts on my experience and why I strongly encourage others to enter competitions like this one.
A time limit makes you focus
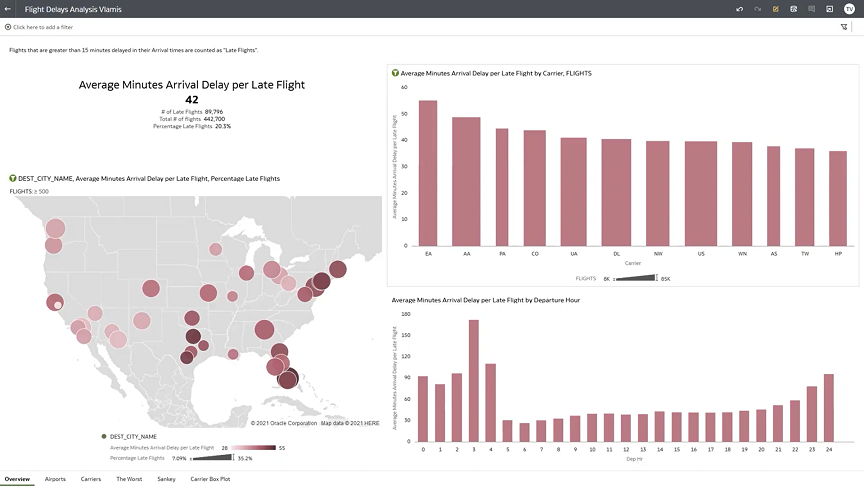
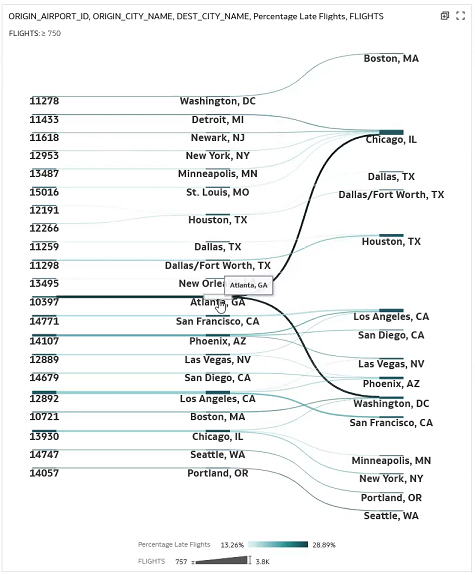
The competition “time window” hit at a particularly busy period for me when I was slammed with multiple projects. When I did sit down to work on it, I knew that it had to be quick. I had a lot of ideas for several things I wanted to do including incorporating some predictive analytics/machine learning, bringing in outside data, and developing a comprehensive treatment of the entire data set. I quickly discovered, however, that in addition to the data visualization time, I also needed to devote a portion of my time to data wrangling/shaping. Relatively early in my process, I decided to focus on a key metric that would guide the development of my data story and on only a portion of the flights: those significantly delayed US domestic flights with actual arrival times being greater than 15 minutes later than their scheduled arrival time.
Something we’ve learned in our consulting practice is that it’s often best to provide some value quickly in a new project and that almost always means ignoring some complexities. While everyone wants a comprehensive solution, developing the “edge cases” often takes a lot of time and resources. We practice the Pareto principle where 20% of the data provides 80% of the value. For the competition, I also figured that the judges (and most dashboard audiences) have a limited amount of time and attention and that I was better off addressing only a portion of the “complete story”.
Frameworks are extremely helpful
We often use a “four quadrant” framework in which we place a “topic tile” for a summary measure in the upper left-hand corner of a dashboard and then place a visualization for the three or four major dimensions related to that measure around it. We then build out a separate page for each dimension and include some summary related findings in their own page. It’s a quick shortcut to development and often yields a nice structural foundation for future work. I wasn’t sure I wanted to use it for this competition because “I wanted to do something different” but given all the complexities of the data and the limited amount of time I had to work on it, I fell back on it as a convenience. In the end, it created the structure for the story and organized my work. You can also think of the “four quadrant” framework as a variation of the “Four Ws” (what, who, where, when), but there are a few others we regularly use.
Placing work in front of your peers for evaluation is very different from working for clients
I love working for clients, especially strong, smart clients who know what they want to accomplish. We can listen to their vision and then provide choices between alternatives with different advantages/disadvantages and let them decide what’s best for them. We often provide something like: “Option A emphasizes this aspect of the scenario and requires a fair amount of engagement from the audience. Option B provides more of a balanced overview that can be understood fairly quickly but doesn’t have the detail. Which one is better for you?” It’s a bit like cooking in a professional restaurant kitchen. Your job is to prepare everything on the menu to a high standard and let the diners choose what they want to eat. When you invite your foodie friends over for a special meal, you’re the one deciding what they’ll eat. It’s completely different. Most of us don’t get a chance to put our work in front of our professional peers and get some objective feedback. It’s priceless and the dynamic is completely different from getting feedback from clients or coworkers. I’ve entered and judged competitions in the creative design industry before, but somehow, I didn’t realize how valuable I’d find this dynamic to be in the analytics field. If you have a chance to enter a future data competition, I’d highly recommend it. You’ll learn a lot—probably more if you don’t win than if you do.
Link to a short video of my winning entry to verify that you can do this too
If you want to see a short presentation of my entry that I made as a practice session before I did an interview with the judges, check it out here. You’ll see that what I built was straightforward and not complex or comprehensive. I hope you’ll see that it’s something that pretty much anyone can accomplish.
The practice presentation is embedded below.
If you want more details on the data set and the data wrangling necessary for the visualizations, see this link: https://youtu.be/iFU3wtD6Ja0
Data Story Telling Rocks!
I was as surprised as anybody else when my name was announced at Kscope 2023 as the winner of the competition. I do want to thank the judges and the hosting organizations: Oracle Developer Tools User Group (ODTUG) and Analytics and Data Oracle User Community (AnDOUC) for running the competition, and of course, Oracle Analytics for hosting the competition.
I believe passionately in the power of data visualization and want to see better dashboards that provide a lot of value to organizations. I’d also like to see more competitions like this one in the future. If anyone wants to talk about frameworks, data visualizations, competitions, or working with clients, reach out to me via email at tvlamis@vlamis.com or on LinkedIn at https://www.linkedin.com/in/timvlamis/ and we’ll set up a time to chat.
