

Client Summary
![]() Sacramento County, centrally located in the state of California, is home to about 1.5 million people and covers an area of roughly 994 square miles. The Sacramento County 311 Connect service provides help with most non-emergency issues for residents in unincorporated Sacramento County. This service enables residents to log service requests for a variety of needs, from animal care issues (such as strays roaming a neighborhood) to waste management concerns (like illegal dumping). These service requests result in mountains of data to report and analyze.
Sacramento County, centrally located in the state of California, is home to about 1.5 million people and covers an area of roughly 994 square miles. The Sacramento County 311 Connect service provides help with most non-emergency issues for residents in unincorporated Sacramento County. This service enables residents to log service requests for a variety of needs, from animal care issues (such as strays roaming a neighborhood) to waste management concerns (like illegal dumping). These service requests result in mountains of data to report and analyze.
The Project
Sacramento County originally approached Vlamis about redoing their Monthly Customer Service Report using Oracle Analytics Cloud (OAC). The OAC platform offered them many more options than their existing static, PDF-based report. Once they saw what Vlamis could do for them using OAC, they began rethinking how they deliver statistics dynamically to their constituents. Vlamis ultimately performed data analysis, modified and improved the configuration of the OAC instance, connected the OAC instance to data sources, performed data preparation activities, created data models, and showed Sacramento County how to discover insights, tell data stories, and track performance over time.
Optimizing Data for Analytics
The Sacramento County OAC system took data from the Oracle Service Cloud, which provides typical reporting such as counts of the service requests coming in. Sacramento County was able to write queries against their Oracle Service Cloud system, but it was not organized for analytics. The system could not go beyond the basics and provide, for example, trends over time or a view of those service requests overlaid on a map.
Vlamis organized the data in such a way that Sacramento County could see what types of requests were coming in, where they were coming from, and what useful patterns the data might reveal. By building and modeling their data using data flows and data sets, we created a foundation that will enable Sacramento County to analyze their service data, resulting in improved customer service for its constituents.
In particular, Vlamis used the data visualization interface in OAC extensively to:
- Add and build data sets and data flows.
- Prepare data.
- Create and apply filters, layers, and overlays.
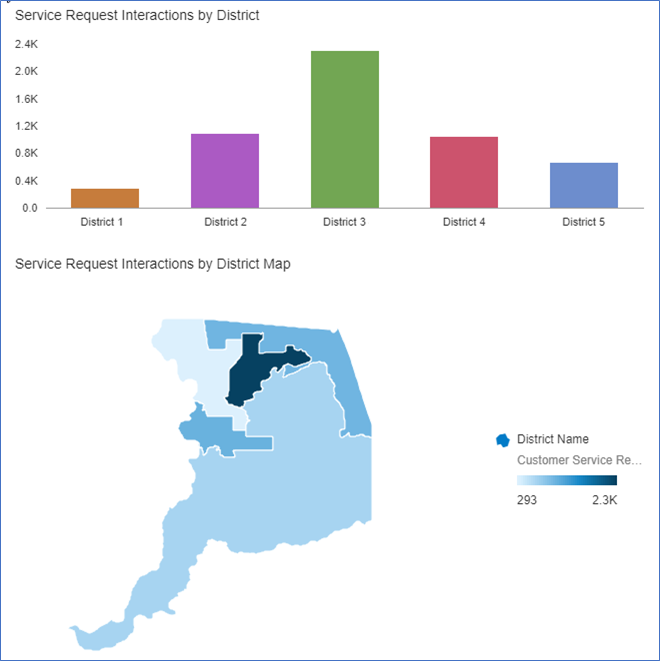
- Visualize data on Sacramento County maps (as shown below).
- Transfer knowledge and provide mentoring and guidance on best practices.
Maps and analytics like the one shown here illustrate the geographic differences in the handling of 311 calls.
Transforming the Monthly Customer Service Report
One significant goal of the project was to take the static monthly Customer Service Report of service requests and statistics – a long, table-based report full of numbers that required several hours of manual preparation – and transform it into an interactive, visual-based dashboard. The report goes out to a large audience of different stakeholders in different roles. Where once they had mere numbers, now they have a graphical representation of patterns that reveals useful insights.
For example, the monthly report included a table showing the top service requests (>10) opened by each district (a partial example of this report is shown below).
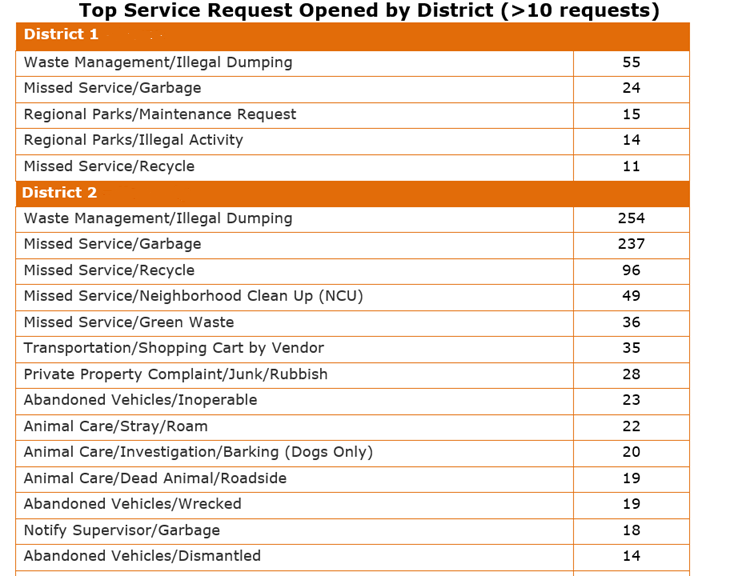
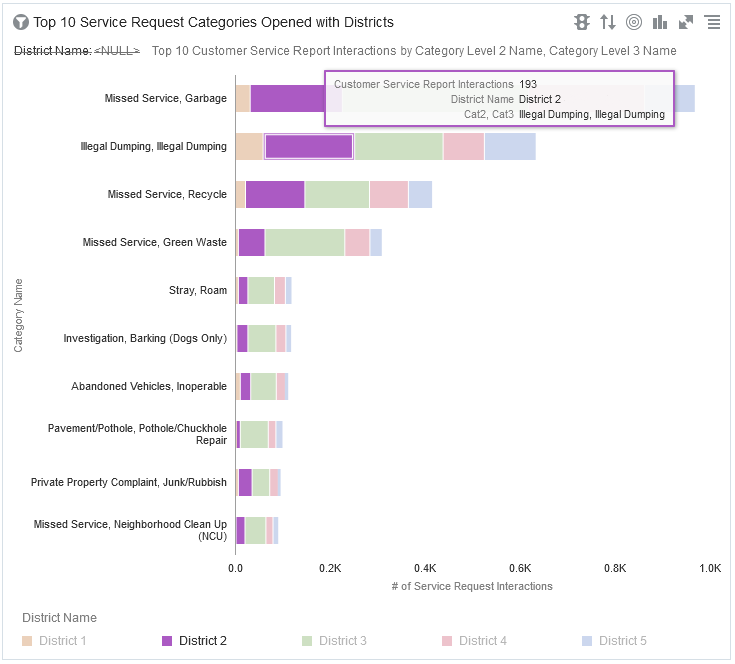
What is missing from this presentation of the numbers is how these different service request types compare across each district, as shown in the new visualization of this data below. Because the visualization is interactive, you can hover over any part of the image to get more details on the numbers behind each segment in the chart.
Reports on the Sacramento County 311 Customer Service Reports web page use Oracle Analytics starting in June 2021.
Benefits
With the completion of this project, Vlamis provided the following benefits to Sacramento County’s 311 Connect team:
- Data sets explicitly designed for analytics run automatically. Well-built data flows and data sets provide a strong foundation that future analytics projects can leverage.
- Interactive visual analytics transform numbers into patterns that reveal insights. Finding previously unknown insights is easier than before. Previously, users had to formulate precise questions to get the answers they wanted from the reporting system.
- Sacramento County can distribute reports quickly and easily on a regular schedule, saving time previously spent developing a monthly report of service requests and statistics.
- Knowledge transfers and mentoring empower users to find answers. With guidance from Vlamis on best practices, reporting methodology standards, and recommendations on data sets, Sacramento County now has the resources to monitor and maintain their reporting.
Technologies Used
- Oracle Service Cloud (OSC)
- Oracle Analytics Cloud (OAC) Professional Edition
The Future
Sacramento County now can easily build out new reports for the future. For example, they can compare the performance of different divisions and departments. Different activities will have different benchmark support times. In addition, they can uncover previously unknown patterns associated with different districts and different times (weekends vs. weekdays vs. holidays). Better analytics empowers Sacramento County as never before to meet the goal of improving residents’ quality of life with cost-effective public services and superior customer service.
For more case studies about Vlamis clients, see our Case Studies page.
