

Oracle Analytics just keeps getting better! OA added a host of new features in late 2020 and early 2021. No single article could do them all justice, so this blog will provide a high-level review of some of the most exciting features, while pointing you to resources to view them all more thoroughly on your own. To see a presentation about these features, including demos, see our Analytics and Data Oracle User Community (AnDOUC) TechCast titled New in Oracle Analytics Spring 2021 and for updated content on the latest release in May, 2021, see our webcast New in Oracle Analytics May 2021, to be given May 18, 2021. In the May 18 presentation we will share our perspective on these features and how they will help you create more engaging analyses and dashboards.
Release Notes
We review what we consider the most impactful features in these releases, but you can find details on these features in Oracle Analytics Cloud documentation:
New Feature Videos
Oracle has created a terrific series of videos on many of the new features. Included below are links to specific videos covering features we especially want to highlight that cover what is new in 2021. Many of these videos are short, just 2-3 minutes in length.
OAC 5.8 and 5.9 New Features
Here are some new features in 5.8 and 5.9 that we found especially helpful.
Visualization
-
Support for WMS/XYZ Maps (5.9). You now can easily add externally-hosted background maps (ESRI, ArcGIS, etc.). Two new formats are supported – WMS (Web Map Service) and XYZ Tiled Maps – which you can specify in the console.
-
Support for Heat Map Layer on Top of Custom Background (5.8). This enhancement enables you to have heat map visualization layers with custom image backgrounds. Because the heat map is just another visualization, it also can be combined with other visualizations and used as a filter (for example, time of day).
-
Sorting Enhancements (5.9). Several sorting enhancements have been released, including: the ability to sort on edges, like Size, Tooltip, and Detail; enhanced sort options in the context menu including an option to clear sorts; multilayer sorting for attributes; and multilayer sorting options in the header of pivot tables and tables.
General Enhancements
-
Token-Based Authentication for Embedded Analytics (5.8). For those of you wanting to view OAC-integrated content directly embedded in your application, this is the enhancement for you. You now can create an application in IDCS for OAC authentication and pass the security token into your own target application HTML.
Data Prep & Machine Learning
-
New DB Analytics: Frequent Item-Sets (5.9). The frequent item-sets feature lets you achieve simple market basket analysis on your detailed data. For example, you can identify the most frequent item-sets of 2, 3, or 4 items that exist in each transaction. Note: This feature does carry a risk of high performance impact on the database.
-
New DB Analytics: Text Tokenization (5.9). You now can easily tokenize text data to identify most commonly occurring words. The feature includes a language-specific lexer for multi-language support. Frequently occurring tokens are identified. You can then join back detailed tokens data with source dataset for complete mashup analysis!
-
Oracle Machine Learning Results Explainability: Additional Outputs (5.9). This feature helps you answer questions for prediction set values, such as: What are the other probable outcomes and respective probability? The feature also makes use of prediction details values, for example, for each record, show the top 5 attributes and values that lead to the prediction outcome. This ensures full explainability of results.
-
Oracle Machine Learning Model Metadata: Related Datasets (5.9). The Details tab now shows Model details, input/output columns and model parameters. The Related tab shows model views in the database with data on model metadata, statistics, decision tree structure.
OAC 6.0 New Features
OAC 6.0 includes lots of new features, but these especially caught our attention:
-
New Data Profiler and Data Quality Insights. This feature provides you with instant visualizations about the contents and quality of your datasets. You can rapidly identify data quality issues; correct issues within the insights themselves; and get immediate re-scoring and recommendations.
-
Multi-Table Data Sets. You can now have multi-table data sets without an RPD file. This feature provides simple data modeling capability for self-service data users. It includes join type control and allows for data from multiple tables from heterogeneous connections or schemes. Multi table data sets can then be blended with other data sets.
-
Expandable Hierarchical Columns in Tables. You can consume hierarchical columns directly into self-service analytics visualizations with the usual interaction gestures. This includes hierarchies from Subject Area or multidimensional uploaded sources (Essbase/EPM XSAs). Unbalanced/Ragged/Parent child hierarchies also are supported.
-
On-Canvas Filter Types Including Date and Measure. List Box filters in on-canvas filters can now include Top and Bottom N, measure, and date filters. This greatly expands the usefulness of on-canvas filters that can appear anywhere on the canvas (not just at the top) and enables more flexible dashboard layouts.
-
Improved Sort Options and Tooltips. Visualizations can now display data sorted by multiple dimensions and measures (but still only those fields that are part of the visualization). We can also provide a tooltip for the title of a visualization.
-
Time Series Forecasting. We can now call a Time Series data mining algorithm in the Oracle database from an OAC data flow. We have much more flexibility and speed in producing forecasts using this method by leveraging the power of the Oracle database. https://youtu.be/LuMTLlhq2-M?list=PL6gBNP-Fr8KW5pcHzCAj3mTsTpmooGEdA
-
Graph Analytics. Multiple Graph Analytics such as Clustering, Shortest Path, Node Ranking (e.g. Page Rank), and Sub Graph algorithms that run in the Oracle database can now be called from an OAC data flow. These can be visualized using the Network 10K plugin to visualize complex relationships between nodes such as customers, people, companies, parts, etc.
-
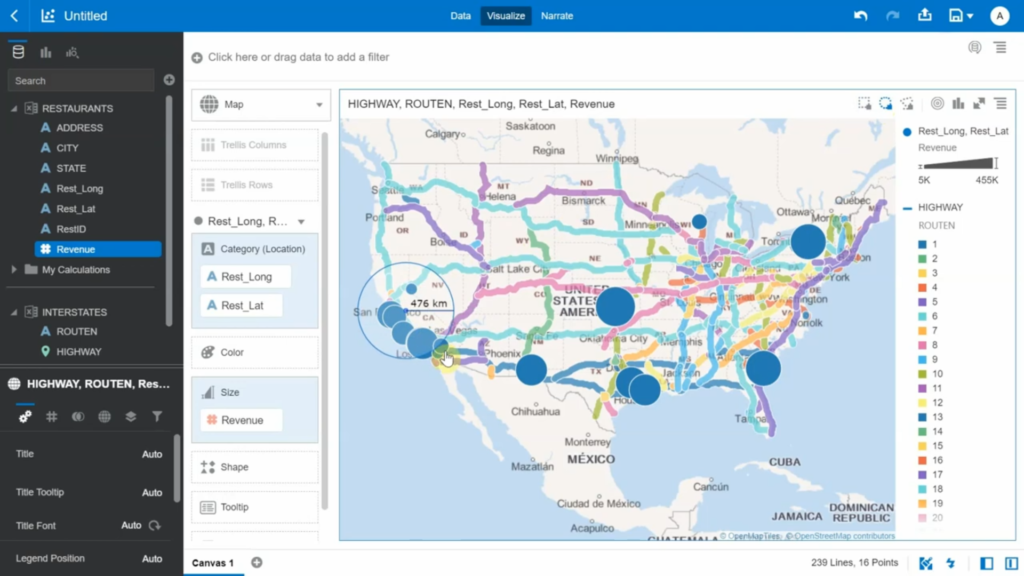
Map Layers in Disjointed Data Sets. A single Map visualization can display multiple data layers sourced from disjointed datasets in a project. The map (usually using longitude and latitude) provides the visual context of the various layers.
-
Export Individual Visualizations. You have more control on exports to PowerPoint and PDF now, including exporting individual visualizations or canvases. You also can export while in Narrate mode.
- Other New Features. There are other features that have been added that don’t have specific videos covering them. For a full list, see this Oracle Analytics Cloud documentation: What’s New in 6.0 Details
Release-Specific Playlists
Below are direct links to the playlists of videos created by Oracle for each of these releases:
OAC Feature Webinars
To see a presentation about these features, including demos, see the Analytics and Data Oracle User Community (AnDOUC) TechCast from April 8 titled New in Oracle Analytics Spring 2021. For updated content on the latest release in May 2021, see the webcast New in Oracle Analytics May 2021 (the page includes information on how to register), to be given May 18, 2021.
