Tips and Techniques

Find version number for OAC

In case you haven’t heard, OAC version 5.6 is now available. OAC instances will be upgraded over the next few weeks. Oh…you don’t know what version you’re on? I kept forgetting where it is, so

Read More »

Ideas to Help Your People Work Remotely

Dan makes an excellent point during our recent O’Reilly course on Enterprise Data Visualization Training, support, and guidance work wonders in helping people feel productive and connected. These are extraordinary times we’re living through and

Read More »

Getting Started with Oracle Analytics

An interviewee (yup, we’re hiring!) recently asked me how to get started with Oracle Analytics. Rather than just answering that person, I thought I would turn this into a blog article for everybody. There are

Read More »

Visualization – Santa Style

I have worked for years on data visualization with organizations making sure that key metrics stood out for executives and decision makers.  This is something I thought I perfected through education and training. In reality,

Read More »

Machine Learning and You: K-Means Clustering

We are seeing a tremendous amount of interest in people wanting to learn more about machine learning, AI, data mining, and predictive analytics. Our presentations addressing these topics are often some of the best attended

Read More »

Creating a Property Graph on Oracle Database

Oracle Database 12c now includes property graphs, a great feature to analyze relationships in your data, such as finding the most influential people in a social network or discovering patterns of fraud in financial transactions. 


Graph analysis can do things that the relational model can’t do – or can’t do without very complicated queries and expensive table joins.  For someone who has never touched a property graph before it can be a little intimidating to get started.  It doesn’t help that most examples seem to start big and kind of assume that you already know what you are doing.  So for the people who are interested in exploring the new property graph functionality of the Oracle Database but don’t have a clue how to get started I thought it would be helpful to put an example together that assumes you don’t know anything.

Read More »

Using D3 and OBIEE

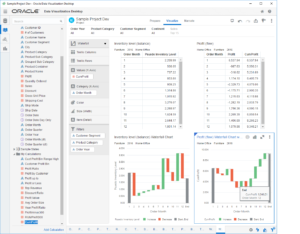
OBIEE is an integration of several pieces of technology that creates an enterprise grade scalable platform for delivering business analytics.  Because of the capabilities of OBIEE, people with no programming skills can create rich and complex visualizations using just the base functionality of the product.   

When organizations do need special visualizations that can’t be accomplished with OBIEE’s delivered visualizations there can be a tendency to turn to other technology stacks because of the perception that either OBIEE isn’t easy to integrate or that using JavaScript libraries, like D3, within OBI will make it harder to upgrade the OBI in the future.   

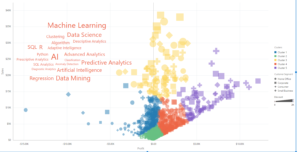
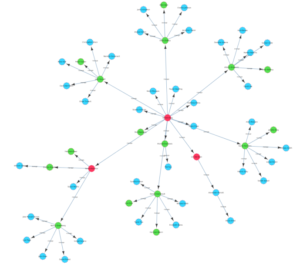
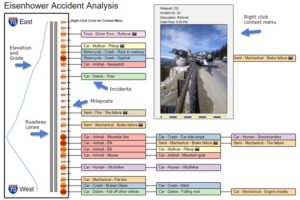
The proliferation of open source technologies for visualizing data in recent years has made it far easier for organizations to build rich and dynamic visualizations targeted at specific analytics needs that simply are not available inside of purchased applications.   

OBI provides a number of key capabilities that are difficult, expensive and time consuming to reproduce.  Some of those capabilities include: a scalable webserver with performance and logging capabilities that has 24/7 worldwide support, the capability to query and federate hundreds of different data sources and create a reusable and extensible business metadata layer, security services that can concurrently integrate with multiple corporate identity management systems and extend that security to row level results, and an analytics deployment mechanism that already extends across the organization.   

Given a business case where (Gasp!) OBIEE can’t provide the needed functionality out of the box how can an organization take advantage of functionality that OBIEE provides and still satisfy their internal requirements?   

Read More »

Tip on using New Waterfall Viz in DVD 3.0

In preparing for my presentation on What’s New in DVD 3.0 Webinar (tomorrow!), I found that the new waterfall visualization was geared towards balance measures (like a checking account balance) instead of a flow or

Read More »

Want to Receive Updates from Vlamis?

Sign up for our newsletter.