

OBIEE is an integration of several pieces of technology that creates an enterprise grade scalable platform for delivering business analytics. Because of the capabilities of OBIEE, people with no programming skills can create rich and complex visualizations using just the base functionality of the product.
When organizations do need special visualizations that can’t be accomplished with OBIEE’s delivered visualizations there can be a tendency to turn to other technology stacks because of the perception that either OBIEE isn’t easy to integrate or that using JavaScript libraries, like D3, within OBI will make it harder to upgrade the OBI in the future.
The proliferation of open source technologies for visualizing data in recent years has made it far easier for organizations to build rich and dynamic visualizations targeted at specific analytics needs that simply are not available inside of purchased applications.
OBI provides a number of key capabilities that are difficult, expensive and time consuming to reproduce. Some of those capabilities include: a scalable webserver with performance and logging capabilities that has 24/7 worldwide support, the capability to query and federate hundreds of different data sources and create a reusable and extensible business metadata layer, security services that can concurrently integrate with multiple corporate identity management systems and extend that security to row level results, and an analytics deployment mechanism that already extends across the organization.
Given a business case where (Gasp!) OBIEE can’t provide the needed functionality out of the box how can an organization take advantage of functionality that OBIEE provides and still satisfy their internal requirements?
OBIEE has always provided the capability to integrate with other technologies and one of the easiest technologies to integrate is open source JavaScript and CSS libraries such as D3, jQuery and jQueryUI.
The steps to using a D3 visualization within OBI are easy:
- Make libraries available
- Create an analysis to get data you can use with D3
- Create visualization
The first two steps are super easy. The third step is where the actual effort is because you have to write some JavaScript code.
Note: you will need to have, or develop, some skills to do step 3 but those skills are on par with other skills within the scope of OBI development. Don’t let this stop you from trying this out!
If you have ever done RPD or ETL work then you can handle JavaScript development. If you haven’t ever worked on the RPD or ETL, but you are sure you could if someone would just show you how, then you can handle JavaScript development. If you have ever created an Access Database, or an absurdly complicated Excel spreadsheet with formulas and macros, then you can handle JavaScript development. If you are obsessive compulsive and capable of using Google then you can handle JavaScript development. If all of these things sound beyond you then you should probably stop now and save yourself the time and effort.
Step 1 – Making Libraries Available
There are 3 possible approaches to getting the JavaScript/CSS you need depending on your situation.
Situation 1 – I have control of my OBI server or the person who does is reasonable and will do stuff if I ask them to and therefore I can put files on my OBI server and deploy the analyticsRes directory.
Oracle documents detailing how to deploy analyticsRes can be found here – https://docs.oracle.com/middleware/12212/biee/BIESG/GUID-237D613D-CC0D-464D-BBC2-9A223CD12567.htm#BIESG9186
There are also at least 100 blog entries on how to do it. It takes about 15 minutes.
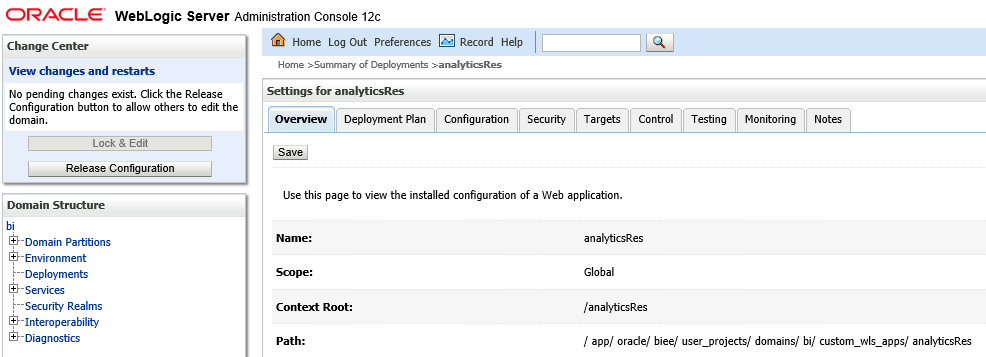
Here’s a screenshot from sampleApp Weblogic console showing the mapping of the analyticsRes deployment to the /app/oracle/biee/user_projects/domains/bi/custom_wls_apps/analyticsRes/ file system directory on the OBI server.
Here’s a screenshot of the contents of that directory on the filesystem –
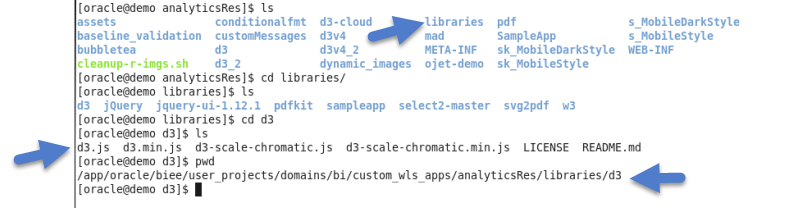
The libraries directory is where I have stashed all my stuff, so if I wanted to prove that the directory can be served over the web I could enter http://MyOBIServer:7780/analyticsRes/libraries/d3/d3.js into a browser and I should see the JavaScript code for D3 –
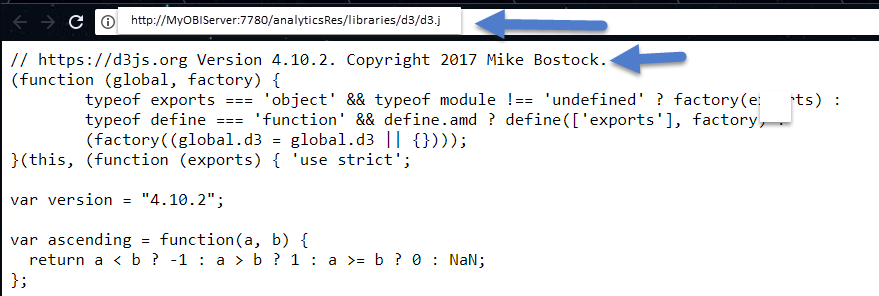
At this point all of the libraries I need to access to make my very own visualization are deployed on the OBI server and available by using a script tag like this:
<script src=”libraries\d3\d3.min.js” charset=”utf-8″></script>
Or a link tag like this for CSS:
<link rel=”stylesheet” href=”libraries\jquery-ui-1.12.1\jquery-ui.css” />
Situation 2 – You can reference links outside your corporate firewall
This is super-duper easy and takes about 1 minute. D3 and jQuery will get you started nicely and you can reference them using the following:
<script src=”https://d3js.org/d3.v4.min.js”></script>
<script src=”https://ajax.googleapis.com/ajax/libs/jquery/3.2.1/jquery.min.js”></script>
If it’s easier you can also load all the libraries you need into an AWS S3 bucket (or your favorite bucket storage) and make the bucket available via URL. The script tags will be exactly as above except referencing the URL for the bucket you have created. You can read up on buckets here: http://docs.aws.amazon.com/AmazonS3/latest/dev/Welcome.html
Situation 3 – Nobody trusts you or it’s just too painful and I wanna do it right now!
You can just copy paste the code from D3 and jQuery into a text area on your dashboard
<script> D3 or jQuery code here </script>
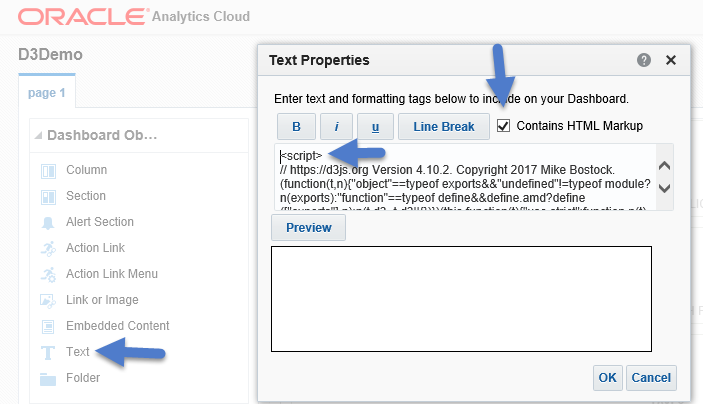
It’s quick, it’s effective, it’s lemon scented but for the love of all that is holy please don’t make this your production deployment approach because it’s also maddeningly slow every time you edit or save your dashboard page, not reusable and will offend anyone with a sense of decency. But I’m not here to tell you how to live so do what you have to do.
Step 2 – Create an analysis to get data you can use with D3
For this example, I am going to produce a visualization that shows all of the sales reps for a given manager as boxes next to that manager’s name. This example pulls data from the commonly-used SampleApp application.
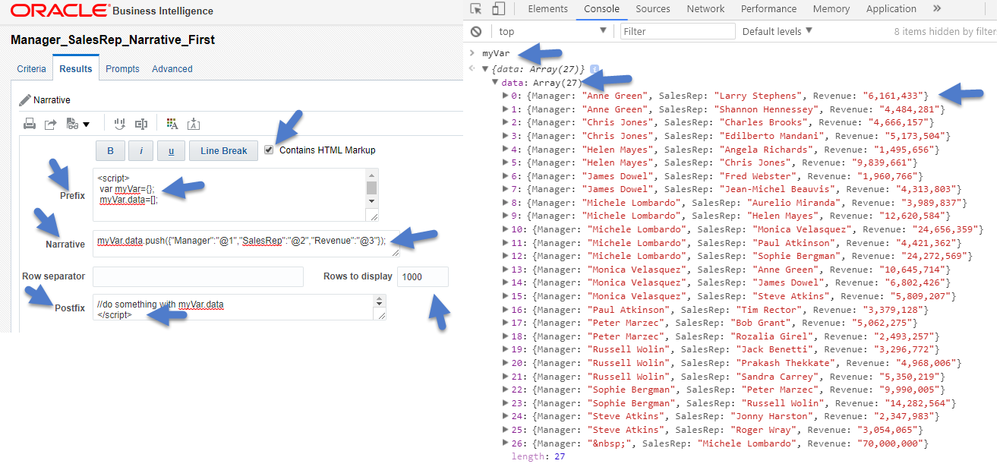
This is as simple as creating a narrative view on an analysis and having it translate data into JSON.
The basic format is as follows:
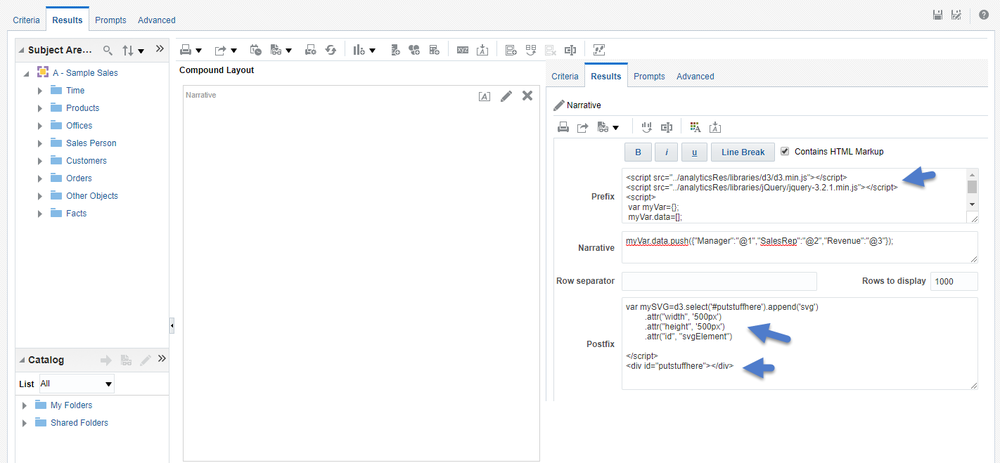
Prefix –
<script>
var myVar={};
myVar.data=[];
Narrative –
myVar.data.push({“col1”:@1,”col2”:@2});
Postfix –
//do something with myVar.data
</script>
Using Sample App we can create a simple example using the Sample Sales subject area:
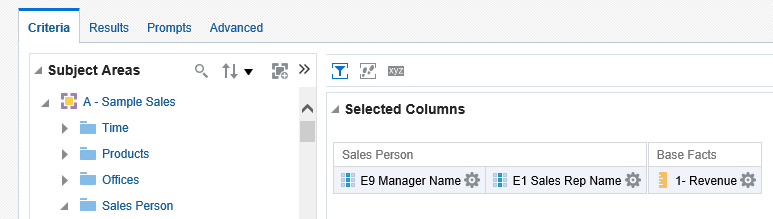
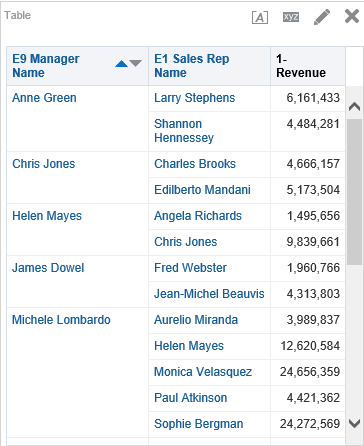
Pulling the Manager Name, Sales Rep Name and Revenue we get a table view like the following –
Next we create a narrative view using our format from above and then using the Developer Tools console of our browser (Internet Explorer in this case) we can check whether our JavaScript variable has been created by entering something in the console and hitting enter. When we do this we see that our object has been created and we can drill down on it to see the data we expect:
With this working we are now ready to move on to creating a visualization.
Step 3 – Create Visualization
Here comes the actual work. JavaScript and D3 (a JavaScript library) are both magical and perplexing. The hardest part about JavaScript is realizing it doesn’t wait to finish one thing before it gets started on the next. This means if you need it to wait for something to happen (like fetch your data) then you need to use a callback function. This will hurt your brain but it’s actually relatively simple after you get the hang of it. We won’t need it for this example but just keep it in mind for later when you get all crazy.
D3 binds data to HTML elements (so you can build awesome visualizations) but what’s strange about it is D3 actually creates placeholders for the visual representations of your data before they exist. It’s not terribly difficult to get used to but it’s a new way of thinking.
So let’s create our very own visualization. First we need to add references to the code libraries in our narrative view and then add a div element that will contain the svg canvas D3 uses to draw our visualization. Then we add the svg to our div element:
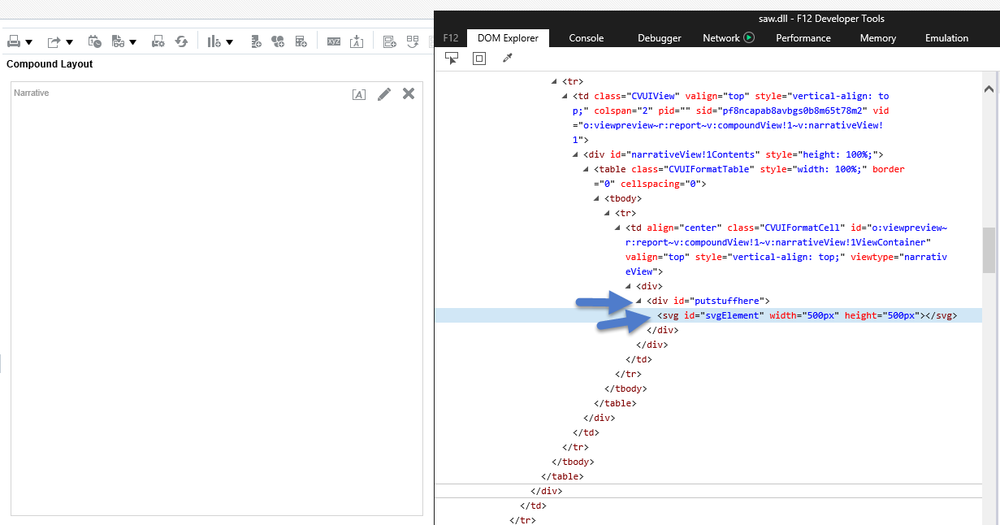
Now if we run our narrative view and use the DOM explorer on our developer tools we can see the element we’ve created:
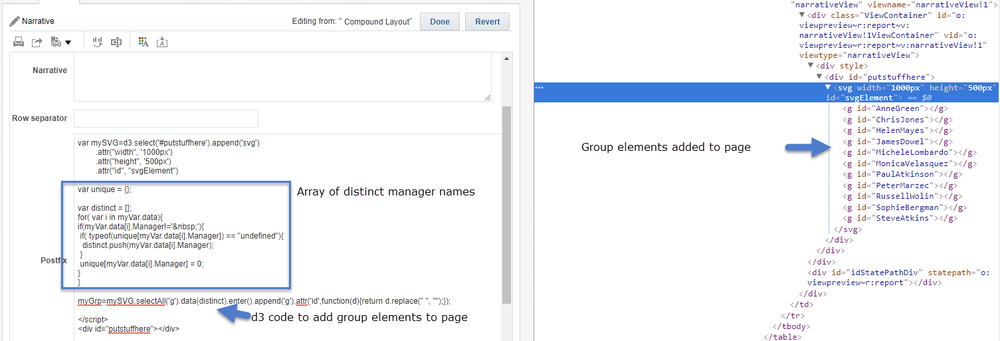
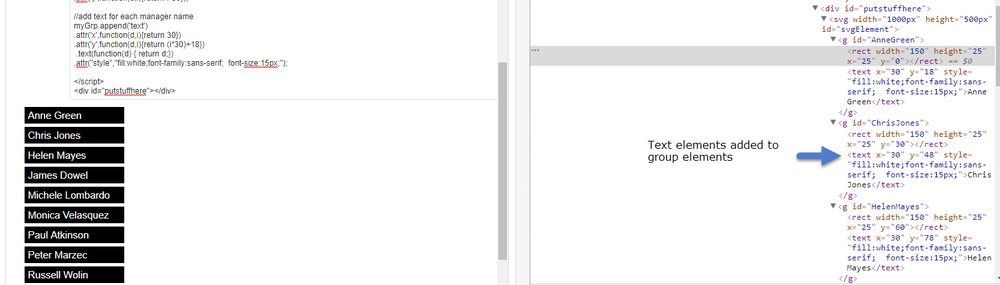
The first thing we will do with our data is create an array of our distinct Manager names using some simple JavaScript and then we will begin using the magic of D3 by creating an html group element for each manager.
Let’s dig in to the function we used to add groups to the page:
myGrp=mySVG.selectAll(‘g’).data(distinct).enter().append(‘g’).attr(‘id’,function(d){return d.replace(” “, “”);});
First you’ll notice that d3 allows us to chain methods. Each period represents a function and we can chain these together to get a lot of work done without being too verbose about it.
myGrp is a variable we assign the results of our function to and will be very useful for the next bit of code.
mySVG is the variable we assigned our drawing canvas to when we appended an svg to the page.
selectAll(‘g’) is the place holder I mentioned earlier and tells d3 that we have some data coming that we would like to do something with
data(distinct) is a reference to the array we created for our manager names
enter() is a function for joining each element in our array to an html element
append(‘g’) actually appends the group elements to our svg
and finally attr(‘id’,function(d){return d.replace(” “, “”);}) gives the html element an attribute ‘id’ equal to the manager name with the space removed. ‘d’ is d3’s way of referring to the data being bound with an element and we use a function to return the value of d when assigning it to an attribute. By inspecting the page with our browser DOM explorer we can see the elements created by our function.
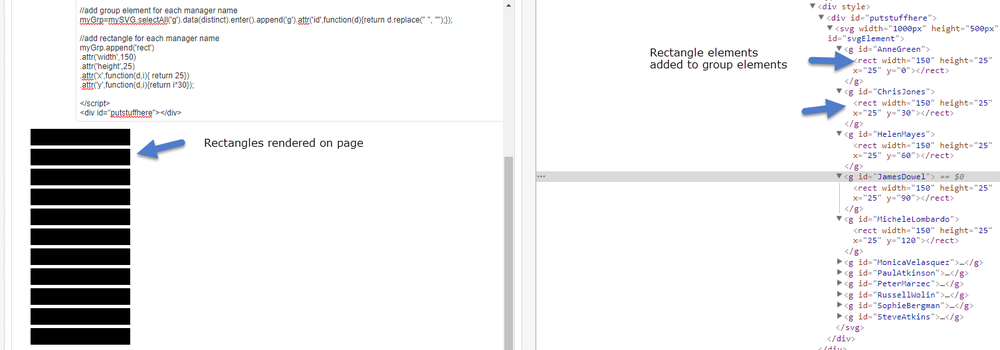
At this point we still don’t have anything visible on the page we’ve just created a group element and bound it to our data, but because we have bound the data the rest is easy. Using the myGrp variable we can append a rectangle and d3 will automatically do it for each data value. Our rectangle just needs some basic information to render like width, height, and the x/y position to draw it. You will see that we use a function to refer to another automatic variable I that represents the element number in our data. We have statically set x to 25 pixels from the edge of our svg and y is incremented 30 pixels down from the top for each element. We can see the result of adding our rectangle below –
myGrp.append(‘rect’)
.attr(‘width’,150)
.attr(‘height’,25)
.attr(‘x’,function(d,i){ return 25})
.attr(‘y’,function(d,i){return i*30});
The obvious thing missing from our rectangles is some text to tell us what they represent. We add this the same way also setting the font color, size and family with the style attribute.
myGrp.append(‘text’)
.attr(‘x’,function(d,i){return 30})
.attr(‘y’,function(d,i){return (i*30)+18})
.text(function(d) { return d;})
.attr(“style”,”fill:white;font-family:sans-serif; font-size:15px;”);
Now if we would like to add rectangles for the Sales Reps that report to each manager it’s as easy as rinse and repeat by looping through our distinct manager array and appending a group, rectangle and text element for each rep.
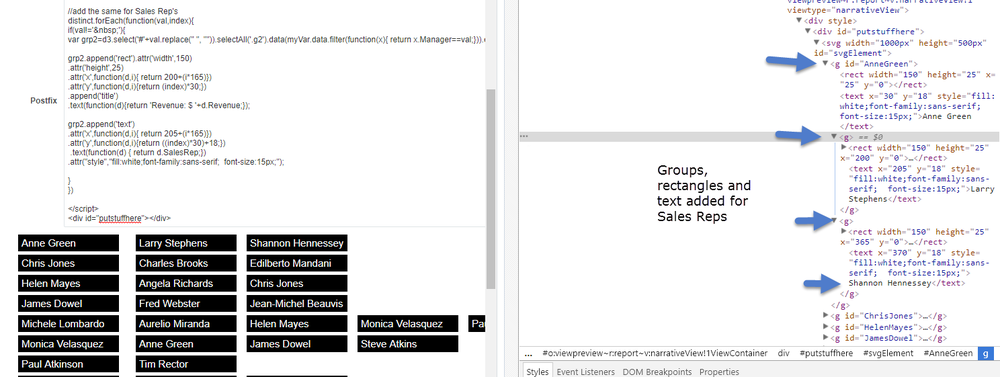
While rectangles aren’t particularly exciting the basic concept shown here can be used to produce nearly any visualization you can think of.
Once you master the basics of creating a simple visualization, the possibilities are almost endless. Here is another example of a project similar to a project I recently completed for a customer.
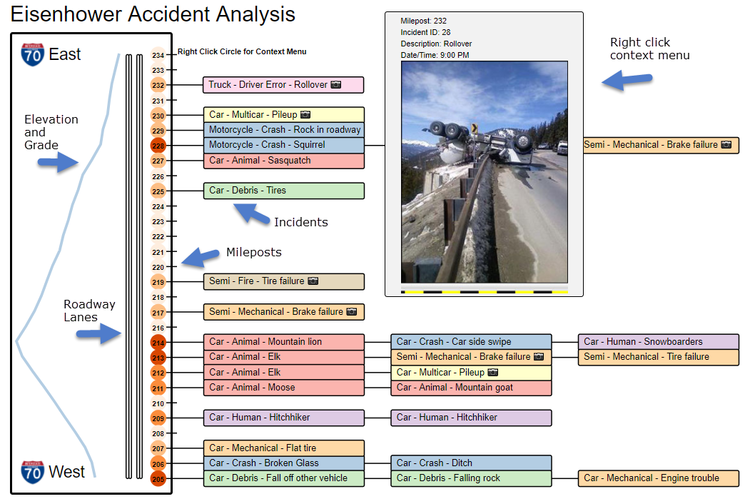
Imagine that we want to render incidents along I-70 at Eisenhower Pass in Colorado and show both the milepost they occurred at and the relative elevation and grade along with creating context menu’s for detail information we might create a visualization like this:
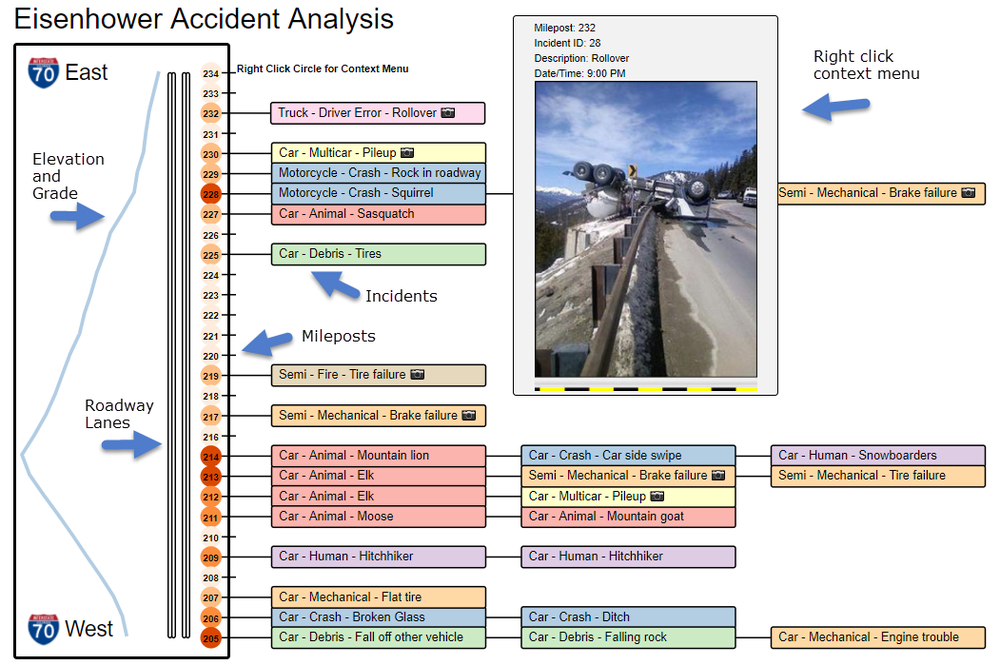
While this may look much more complicated, it’s just adding some additional properties and uses the same basic techniques as the previous simplistic example.
I hope this post gives you an idea of how easy it is to use d3 and other libraries inside of OBI and a sense of what’s possible if you have a requirement a custom visualization. Happy coding!
