


Small Is Beautiful
In the construction world, bigger is often better. For large construction projects you need large-scale machinery and spend much of your time developing a blueprint for the building that must stand with no changes to

How to Keep Your Analytics Project On Time and On Budget
Analytics projects are notoriously complex. They bring together a team of professionals in various roles with different strengths and weaknesses. That team must satisfy the competing expectations of diverse stakeholders and users and deliver a
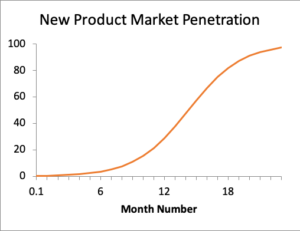
Why Data Visualization Is Vital to Enterprise Success
Using visual imagery, or visualizations, is an effective way to communicate ideas, whether abstract or concrete. The presentation of data in visual form, typically through graphs, maps, charts, and small tables is often collectively referred
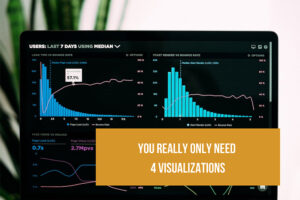
You Really Only Need Four Visualization Types for Effective Dashboards
We lead a lot of training on data visualization and we mentor analysts in many of the world’s leading corporations. It’s not uncommon for analysts to ask about advanced visualizations in the beginning of our
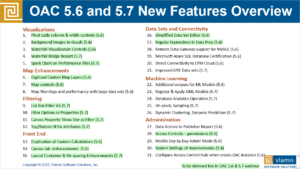
Webinar on What’s New in Oracle Analytics 5.6 and 5.7 with Live Demo on August 5
I spent the weekend preparing slides and demos for my webinar titled “What’s New in Oracle Analytics 5.6 and 5.7” to be presented on Aug 5 at 12pm US CDT. Just like past webinars in
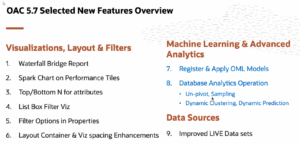
Webinar: What’s New in Oracle Analytics 5.6 and 5.7 – August 5
Oracle Analytics releases are coming faster and faster. We are combining information for versions 5.6 and 5.7 into a single webcast to be presented August 5, 2020 at 12:00 p.m. US Central time. Register today! Major

All Good Projects Must Come to an End
Saying goodbye to the Sunoco FAMIS project… I was hired by Vlamis back in 2004 to work on the migration of an outdated Oracle Express, PCX 5.0 installation to the “new” Oracle OLAP 10g. It
Presenting panel as part of AnDOUC TechCast Days July 9
We need your ideas! I will be presenting a panel along with Edelweiss Kammermann and Philippe Lions as part of AnDOUC TechCast Days. Our session will focus on “Challenges, Solutions, Workarounds: Making Analytics Systems Work“
Vlamis Featured in Oracle Howdy Partner Series
Brendan Doyle released his latest Howdy Partner video. It was a lot of fun to be interviewed by Brendan Doyle as part of his “Howdy Partner” series on YouTube. Brendan has an easy-going style that
