

I recently had the opportunity to present to Mrs Neth’s local elementary school class. There’s a lot to be learned from 3rd graders. The subject of the presentation had to do with community activism and the future placement of a community walking trail that is planned to be constructed behind my house. Most of the presentation had to do with how I met with the local Parks Department and lobbied the City Council politely (not chest-thumping and finger-pointing like we see politicians on the news these days) to get the community’s input on the exact placement of the trail.
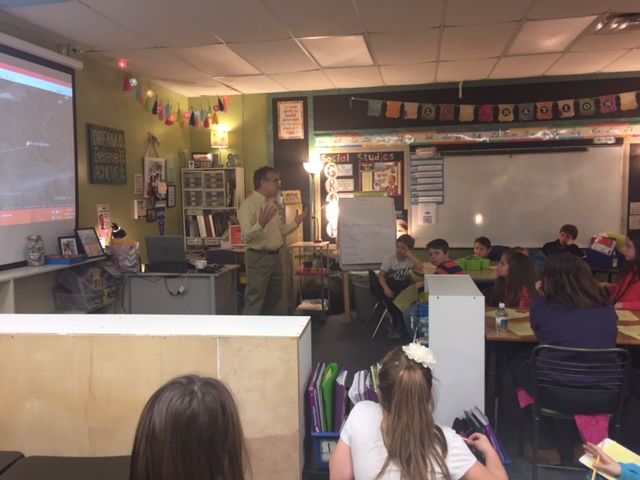
But what struck me was the level of engagement that the 3rd graders had once I started showing them how I used an app on my phone to plot out the precise route of the trail, and how with Google Earth and satellite imagery I was able to show a “fly-by” of the trail. I even recorded a video of the virtual tour of the trail from the air. My point is that a picture (video in this case) captures the imagination the way nothing else does. Even 3rd graders get excited about civic involvement (they are all excited about saving a huge sycamore tree that is in danger of being cut down due to the trail placement) once they see a picture. They have a web page that is devoted to the project.
Thanks, Mrs. Neth, for the opportunity to share with your classroom! You’re doing a great job involving students in real projects in the real world!
