BI

Getting Started with Oracle Analytics

An interviewee (yup, we’re hiring!) recently asked me how to get started with Oracle Analytics. Rather than just answering that person, I thought I would turn this into a blog article for everybody. There are

Read More »

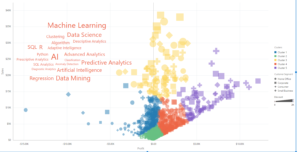
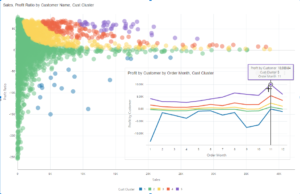
Machine Learning and You: K-Means Clustering

We are seeing a tremendous amount of interest in people wanting to learn more about machine learning, AI, data mining, and predictive analytics. Our presentations addressing these topics are often some of the best attended

Read More »

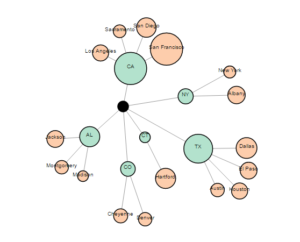
Vlamis Force Directed Graph Plugin

The Force Directed Graph plugin from Vlamis Software Solutions in collaboration with Oracle allows you to visualize your data by creating an interactive node and link diagram. Each node’s location is customizable and are held

Read More »

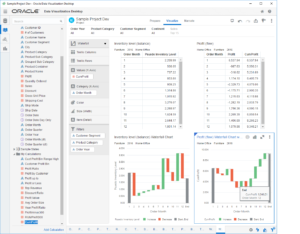
Tip on using New Waterfall Viz in DVD 3.0

In preparing for my presentation on What’s New in DVD 3.0 Webinar (tomorrow!), I found that the new waterfall visualization was geared towards balance measures (like a checking account balance) instead of a flow or

Read More »

Data Visualization for OBI Book at Kscope

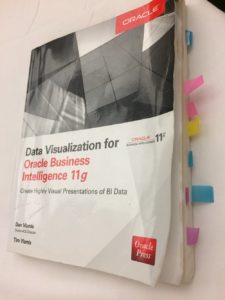
Tim and I were attending the Kscope16 conference in Chicago and were thrilled to see the Jessica had brought her well-worn book, Data Visualization for Oracle Business Intelligence to the conference.  As you can see

Read More »

Want to Receive Updates from Vlamis?

Sign up for our newsletter.