Creating a Property Graph on Oracle Database
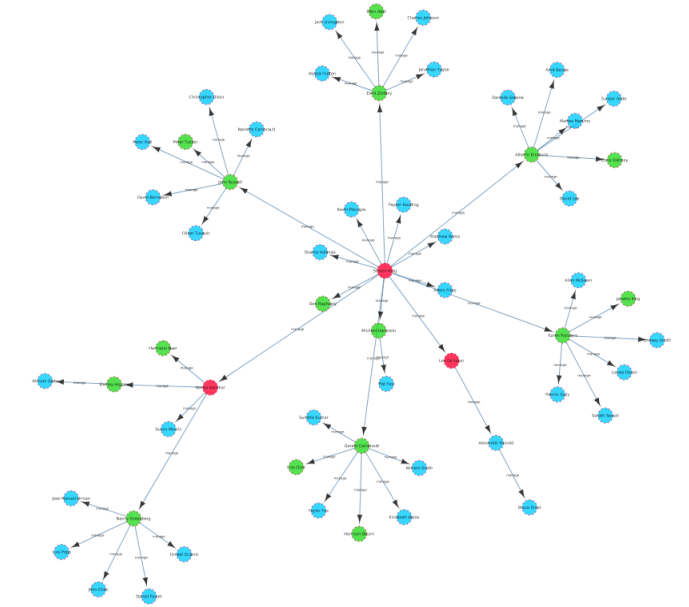
Oracle Database 12c now includes property graphs, a great feature to analyze relationships in your data, such as finding the most influential people in a social network or discovering patterns of fraud in financial transactions.
Graph analysis can do things that the relational model can't do - or can't do without very complicated queries and expensive table joins. For someone who has never touched a property graph before it can be a little intimidating to get started. It doesn’t help that most examples seem to start big and kind of assume that you already know what you are doing. So for the people who are interested in exploring the new property graph functionality of the Oracle Database but don’t have a clue how to get started I thought it would be helpful to put an example together that assumes you don’t know anything.


