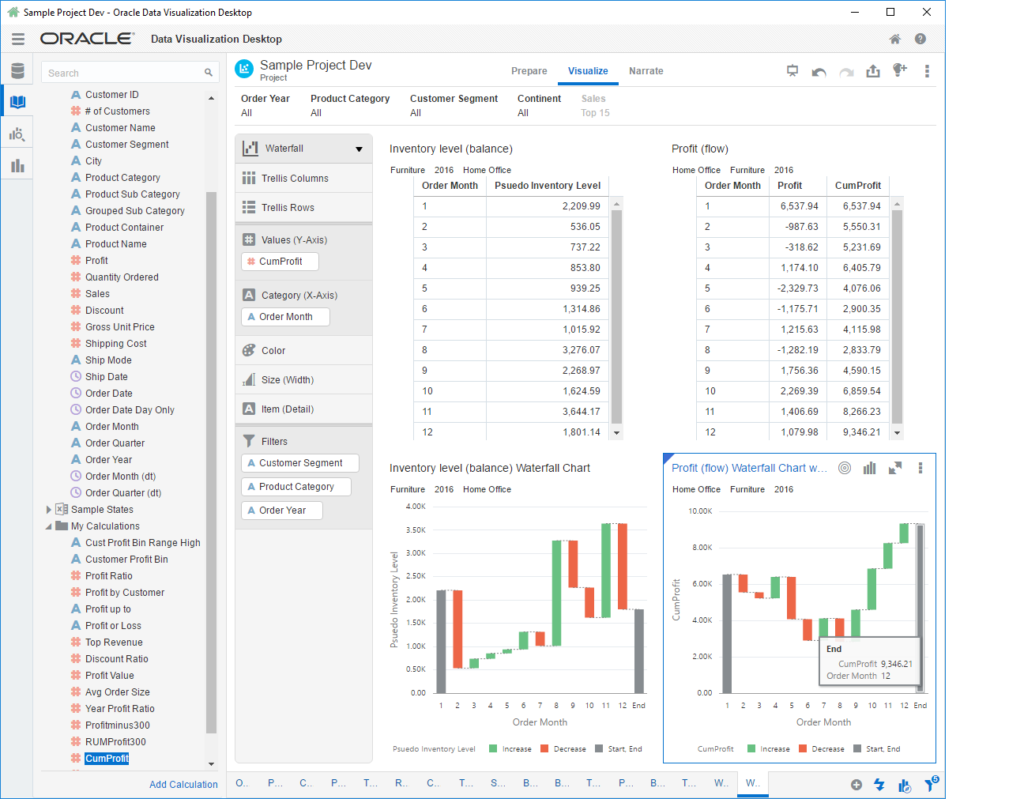
In preparing for my presentation on What’s New in DVD 3.0 Webinar (tomorrow!), I found that the new waterfall visualization was geared towards balance measures (like a checking account balance) instead of a flow or performance measure such as profit. One of the key differences is that for a flow measurement the value can easily be negative. In any business, you may lose money in a given period, but you hope to make up for it in prior or future periods. In addition, flow analysis can be great for showing sources of gains and losses. A waterfall graph typically shows this very nicely.
But the waterfall graph in DVD 3.0 is designed for balance information.
In order to use the waterfall graph, you can convert from the flow measure (such as profit) to a balance by using the RSUM function in OBIEE. Put simply, RSUM(profit) gives you the running sum of profit for the year, adding up each month. It accumulates the profit which is exactly what you need in order to use the waterfall graph.
So, on the left you can see a waterfall graph of an inventory balance. No special formulas needed. On the right, you can see a waterfall graph of profit. In this case, we actually use the cumulative profit measure so we can properly visualize the periods where we lost money. We can easily see that we ended the year with a total of $9346.


