We are seeing a tremendous amount of interest in people wanting to learn more about machine learning, AI, data mining, and predictive analytics. Our presentations addressing these topics are often some of the best attended at conferences. I believe there are two fundamental drivers for this: the first is a sincere desire to learn about new things and new capabilities. The second is a very real fear of not knowing about machine learning and the like and having others (particularly higher-level executives) expect that you know about it. We see this especially with people involved in business intelligence and analytics on the business side and also with IT managers and executives who are expected to explain what their strategy or road map is for machine learning and advanced analytics. However, the observation that machine learning is a lot like teenage sex is fairly apt: everyone talks about it but few actually do it. And many of those who do do it, don’t really know what they are doing.
Here are some of things that we try to emphasize to get people over their fear.
- These are just calculations like thousands of other calculations in your system.
- You typically don’t get only one answer, but a series of answers that can be considered together to provide context on how to use them.
- You don’t have to know the specifics of the calculation to be able to understand and use the results.
- You likely understand the concepts, but the words that are used are unfamiliar and sound hard. Once you learn some new vocabulary, it seems like a normal part of your system.
- It’s helpful to be able to explain the basics to others. This skill frees analysts to use the powerful and accessible machine learning tools in the Oracle Analytics Cloud. No one likes getting “challenge questions” from their superiors and being unable to answer them.
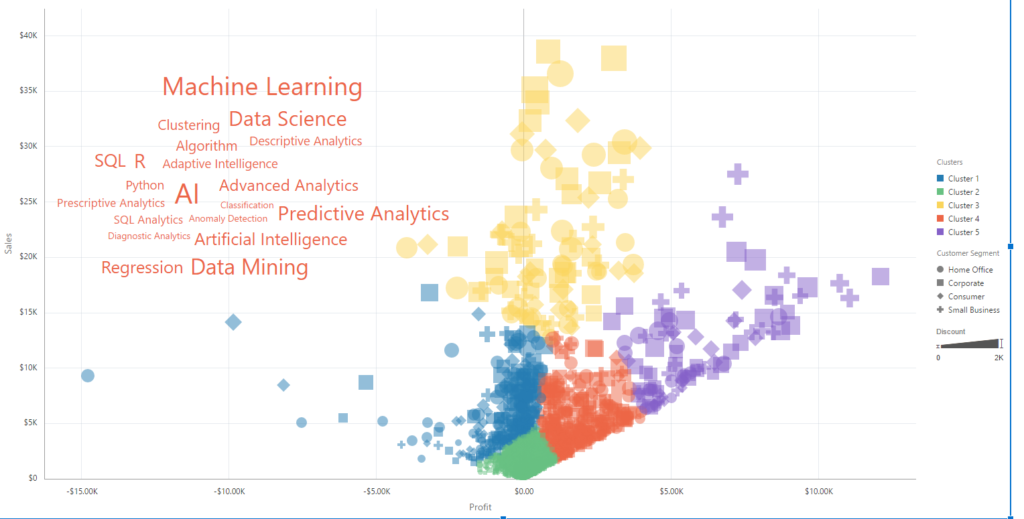
For example, let’s look at a K-Means clustering algorithm. Clustering is used to help reveal similarities and differences in sets of data elements such as customers, orders, locations, products, etc. Whenever you have a lot of something and you want to know “what are the natural patterns in similarities and differences and how can we organize this very large set into smaller sets of like elements that are different from one another?”, we use clustering.
A very common business use case is to cluster the set of customers that a business has into segments that are differentiated from one another. We do this all the time with business intelligence queries. We separate customers and aggregate the results by all kinds of attributes. We might look at customers by location and separate them by state or zip code and then look at the aggregated results to see where customers are buying the most and the least. We might look at customers by what products or services they purchased or when they made their purchases. We might use descriptive attributes such as number of employees, or how long they’ve been a customer, or whether they purchase online or in-store. What is common for all of these analyses is that the analyst is determining how to organize the groups of customers. We might have dozens or even hundreds of possible attributes which we could use.
Clustering offers us a methodology for letting the data tell us where the commonalities exist across many dimensions and many attributes. There is no right and wrong in clustering. Just a mathematical calculation and cluster assignment. But there is also a lot of other information we can get about both the clusters and about the members of each cluster. How many members are in each cluster? What is the average or center of each cluster? How close or far apart are those cluster centers from each other? How close is each member of a cluster to its center? Which of the attributes contributes the most in determining cluster assignments?
The K-Means clustering algorithm is just a method for organizing the elements by which ones are close together. It is a procedure for minimizing the total distance between a given number of centroids (cluster centers) and the data elements. To be fair, there are several different versions of K-Means, but fundamentally, it is a distance minimization algorithm. So all we’re doing is grouping customers into a given number of segments and using math and the data itself to make the assignments rather than making the assignments using a human-stated rule(s).
If you wondering, well how else could we determine which element goes to which cluster besides distance? There are two other basic methods, drawing straight lines through the data space to separate elements into areas of similarity and calculating the density of areas to determine regions of similarity. Sounds easier than Orthogonal Partitioning and Expectation Maximization, right? But more about those algorithms later.


