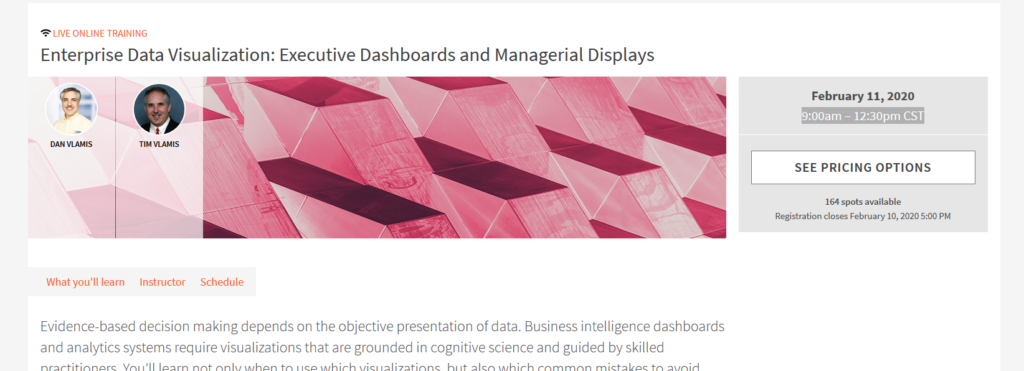
I’m getting more and more excited for the class Dan and I are teaching on February 11 for O’Reilly Live Online Training, especially the chance to bring a perspective that I believe is largely missing from much of today’s literature on data visualization, mainly the perspective of designing dashboards and displays with tradeoffs in mind. For example, the more prompts, links, drills, and interactions that you include in a dashboard’s design, the less chance that different people will see the same data and share the same insights. There’s no way getting around this; literally more choice means less shared understanding. While meeting different individuals’ needs with a single design may be great for BI developers facing a long backlog of requests because they can “kill two birds with one stone”, it’s not great for driving organizational coherence. This doesn’t mean that we should only focus on designing “data stories” that lead users to a defined set of insights. Rather, we need to teach analytics developers to offer effective guidance to their constituents and stakeholders and consciously choose strategies and techniques for different situations and priorities. We’ll introduce frameworks for sorting through these everyday balancing acts along with practical advice gleaned from our years working with enterprise clients.
We’ll cover the basics of best practices in graph choice and design. Things like when to use bar graphs versus line graphs and how to best design them from a data interpretation perspective. But honestly, there’s lot of great material out there on this right now. What’s so often missing is guidance on how many prompts to put on a dashboard or how to assess how much resource should go into building a particular dashboard. Less is often more, but that means where and when to stopping adding things and how to communicate the relative value of different requests to the executives and line-of-business managers requesting them. We’re often working with large organizations that have very diverse audiences for their systems- typically hundreds or thousands of users across many different geographies, different organizational roles, and with different (sometimes competing) priorities, perspectives, and timelines.
We’ve had great response from the private training sessions we’ve done for corporations, NGOs, and government offices for many years, and now we have the chance to share some of our material to a broader audience. This session will be much less about where-to-click and more about how-to-think, less about features and functions of a particular software system or language and more about frameworks and strategies that can guide your development process no matter which specific data visualization and analytics system you’re using.
If you’re interested in joining us for this live training event, visit the registration page and tweet us @VlamisSoftware to let us know!
This training course will take place from 9:00am-12:30pm Central on February 11, 2020.


