

Client Summary
OUTFRONT Media, one of the largest outdoor advertising and media firms in the United States, is transforming their enterprise through analytics with a relatively small team by embracing and leveraging the advanced capabilities of Oracle Analytics and Oracle Autonomous Data Warehouse (ADW) Cloud.
The Problem
For OUTFRONT Media, location is paramount. So visualizing their data using maps just makes sense. They wanted a simple project that could demonstrate the power of spatial analysis to their executives. This project was conceived after hurricane season when the expense and risk exposure were fresh in mind. When hurricanes are forecasted to go through or near OUTFRONT Media assets, OUTFRONT Media must quickly decide whether to send crews to take down billboards, thus saving the structure from being destroyed. Taking down and resurrecting signs takes labor, and OUTFRONT would lose the revenue while the sign was not displayed, but a partially dismantled sign would have a better chance of weathering the storm, saving revenue for years to come. This seemed like the perfect opportunity to use analytics in a “proof of concept” project, so that the techniques could be developed in anticipation of future hurricane seasons.
The Vlamis Solution
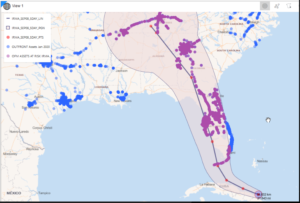
Vlamis combined publicly available data from the United States National Oceanic and Atmospheric Administration (NOAA) and internal data related to OUTFRONT’s billboards and other assets. We used advanced geospatial algorithms in ADW via a “drag-and-drop” GUI called Spatial Studio to determine which assets were most at risk from hurricane force winds associated with Hurricane Irma.
We created custom maps with several layers of different NOAA data sources and then transferred them from Spatial Studio into Oracle Analytics to share various insights regarding specific locations with others at OUTFRONT and to combine assets at risk with income statistics and other business metrics. Interactive maps are one of the most intuitive and powerful of all data visualization types. Interactive maps are native in Oracle Analytics Cloud and easily created with a few clicks.
Armed with the techniques and insights delivered by this proof of concept, OUTFRONT is now ready for future hurricane events.
Technologies Used
- Oracle Autonomous Data Warehouse
- Oracle Analytics Cloud
- Oracle Spatial Studio
Postscript
The experience gained from the hurricane project was put to use in an unexpected way in the spring of 2020 when a storm of a different sort came: COVID-19. Instead of signs being blown down by storms, they simply were not being viewed because people were not out driving. OUTFRONT Media used some of the same techniques and technologies to analyze the difference in viewing of billboards. OUTFRONT could see which locations were in counties most impacted by COVID-19 outbreaks. This allowed them to predict which advertisers were going to want to adjust the location of their ads.
OUTFRONT continues to investigate where they can use maps and spatial technologies to analyze and visualize their data.
For more case studies about Vlamis clients, see our Case Studies page.
